


Looker Studio
reporting
Looker Studio reporting puts your marketing on one page: leads and sales by channel, ad spend, cost per lead and the trend against last month. I build dashboards that answer the questions owners ask, connected to GA4, Google Ads, Search Console and Meta, and updated automatically, so you don't wait for a PDF to know how the month is going.
Free: a 30-minute call, an action plan and a price range in writing.
What a useful
report shows
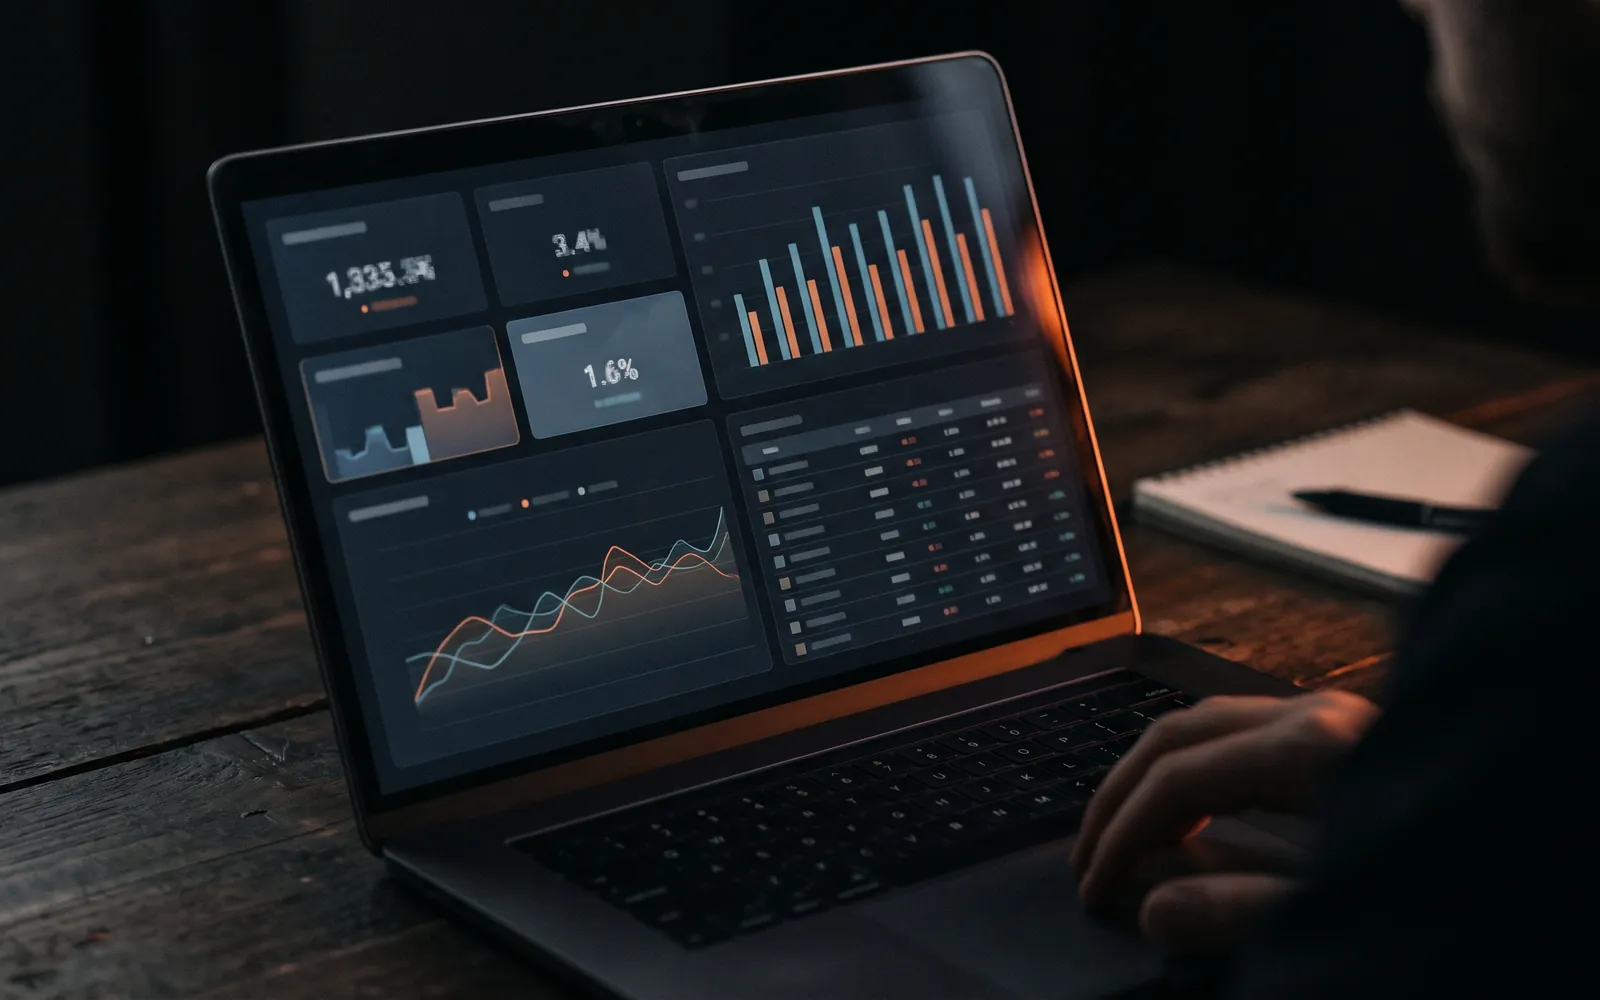
Leads by channel
Calls, forms and bookings split by Google Ads, Meta, organic search, Maps, email and referrals.
Spend and cost per lead
Ad spend from each platform next to the leads it produced, with cost per lead calculated for you.
Trend lines
This month against last month and the same month last year, so seasonality doesn't fool anyone.
SEO view
Search Console clicks, top queries and landing pages, plus organic leads from GA4.
Revenue, where available
Orders and revenue for stores, or closed deals from your CRM if it is connected.
Notes
A short text box each month: what changed, what I did and what comes next.
How a dashboard
is built
Questions first
A short call about what you need to see weekly and monthly, and who else reads the report.
Data check
Tracking verified before any chart is built. A dashboard on bad data is just a prettier lie.
Build
Data sources connected, pages designed for a laptop and a phone, plain labels instead of jargon.
Walkthrough
A Zoom call to show you around, then small adjustments after the first month of use.
A dashboard
or reports with
management
Prices in US dollars.
A standalone Looker Studio dashboard. Price depends on data sources and pages.
- GA4, Google Ads, Search Console
- Meta via a connector
- Walkthrough call
- Owned by you
When I run your Google Ads, the dashboard and reports every two weeks are included.
- Campaign management
- Dashboard included
- Reports every 2 weeks
- No minimum term
Why Looker Studio reporting beats exported PDFs
Many small businesses receive marketing reports as a PDF once a month: twenty pages of screenshots from different platforms, each with its own definitions and date ranges. By the time it arrives, the month is over, and the useful information is buried between charts nobody asked for.
Looker Studio reporting replaces that with a live dashboard. Data comes straight from GA4, Google Ads, Search Console and, through a connector, Meta. You open a link and see the current numbers, any day of the month. The dashboard belongs to your Google account, so it stays with you whoever runs your marketing.
Designing for the person who reads it
The biggest mistake in dashboards is showing everything. A good report for an owner has one main page with five to eight numbers: leads this month, leads by channel, ad spend, cost per lead, revenue if available, and the same figures for last month. Detail pages for each channel sit behind it for anyone who wants to dig.
I use plain labels. "Calls and forms from Google Ads" instead of "Conversions (Google Ads)". "People who visited" instead of "Active users". Small things, but they decide whether the report gets read or ignored.
Numbers that match across platforms
Google Ads, Meta and GA4 count conversions differently. Each platform tends to take credit generously, and adding their numbers together gives a total bigger than reality. In the dashboard I make the source of each number clear and, where possible, use one source of truth for total leads, usually GA4 or the CRM, with platform numbers shown for optimization only. That keeps the headline number honest.
What you need before a dashboard makes sense
A dashboard can only be as good as the tracking behind it. If calls aren't tracked or conversions are counted twice, the dashboard will display those errors beautifully. So the first step is always a check of the underlying setup. If it needs work, the GA4 and Google Tag Manager setup comes first.
UTM tags on every link you control, such as newsletters, social posts and QR codes, make the channel breakdown much more accurate. The UTM guide explains a simple naming system.
A typical layout
Page one: the month at a glance, with leads, spend, cost per lead and a short note. Page two: Google Ads by campaign. Page three: Meta by campaign. Page four: SEO, with Search Console queries and organic leads. Page five: the website, showing which pages turn visitors into inquiries. Owners mostly live on page one; the rest is there when a number looks surprising.
Reporting rhythm
For clients whose ads I manage, I send a short report every two weeks and a fuller one monthly, built on the same dashboard. For SEO clients, monthly. Each comes with a few sentences: what happened, why, and what I'm changing. You can open the dashboard any time between reports.
Going further: revenue and profit
Leads are a good start, but some leads are worth far more than others. When the dashboard connects to your CRM, it can show deals closed and revenue by channel, which is where end-to-end analytics comes in. Together with your average job value and margin, that answers the real question: which channels make money, not just which ones make the phone ring. For the basic math, see cost per lead and the free ad ROI calculator.
Ownership
The dashboard, its data sources and any connectors are set up under your accounts. I'm added as an editor. If we stop working together, you keep the dashboard and it keeps updating. That principle applies to everything I set up, as described on the web analytics page.
Reporting and
measurement
Reporting
questions
Why Looker Studio and not a paid reporting tool?
Looker Studio is free, belongs to your Google account and connects natively to GA4, Google Ads and Search Console. For most small businesses it does everything needed. Paid tools make sense for agencies managing dozens of clients, not for a single business.
Can the dashboard include Meta ads?
Yes, through a connector. Google doesn't offer a free native Meta connector, so a third-party one is used, usually with a monthly fee paid by you. Alternatively, Meta results can be summarized from GA4 data with UTM tags, which costs nothing but is less detailed.
How often does the data update?
Each time you open the dashboard, it pulls recent data from the sources, typically with a delay of hours to a day depending on the platform. No manual exports, no waiting for month-end.
Can my staff or partners see it?
Yes. You share it like a Google Doc, with view or edit rights. Some owners share a simplified page with partners or investors and keep the detailed view for themselves.
What if the numbers on the dashboard look wrong?
Usually it is the tracking, not the dashboard. That's why I verify tracking before building. If something looks off later, I trace it back to the source and fix it there.
See your whole
marketing on
one page
Tell me which channels you run and what you'd like to see every Monday morning. I'll reply within one business day, or we can sketch it on a free 30-minute call.