

A Looker Studio dashboard for a small business
How to build a Looker Studio dashboard a small business owner will actually open: data sources, a four-page layout, connecting CRM data and avoiding chart overload.
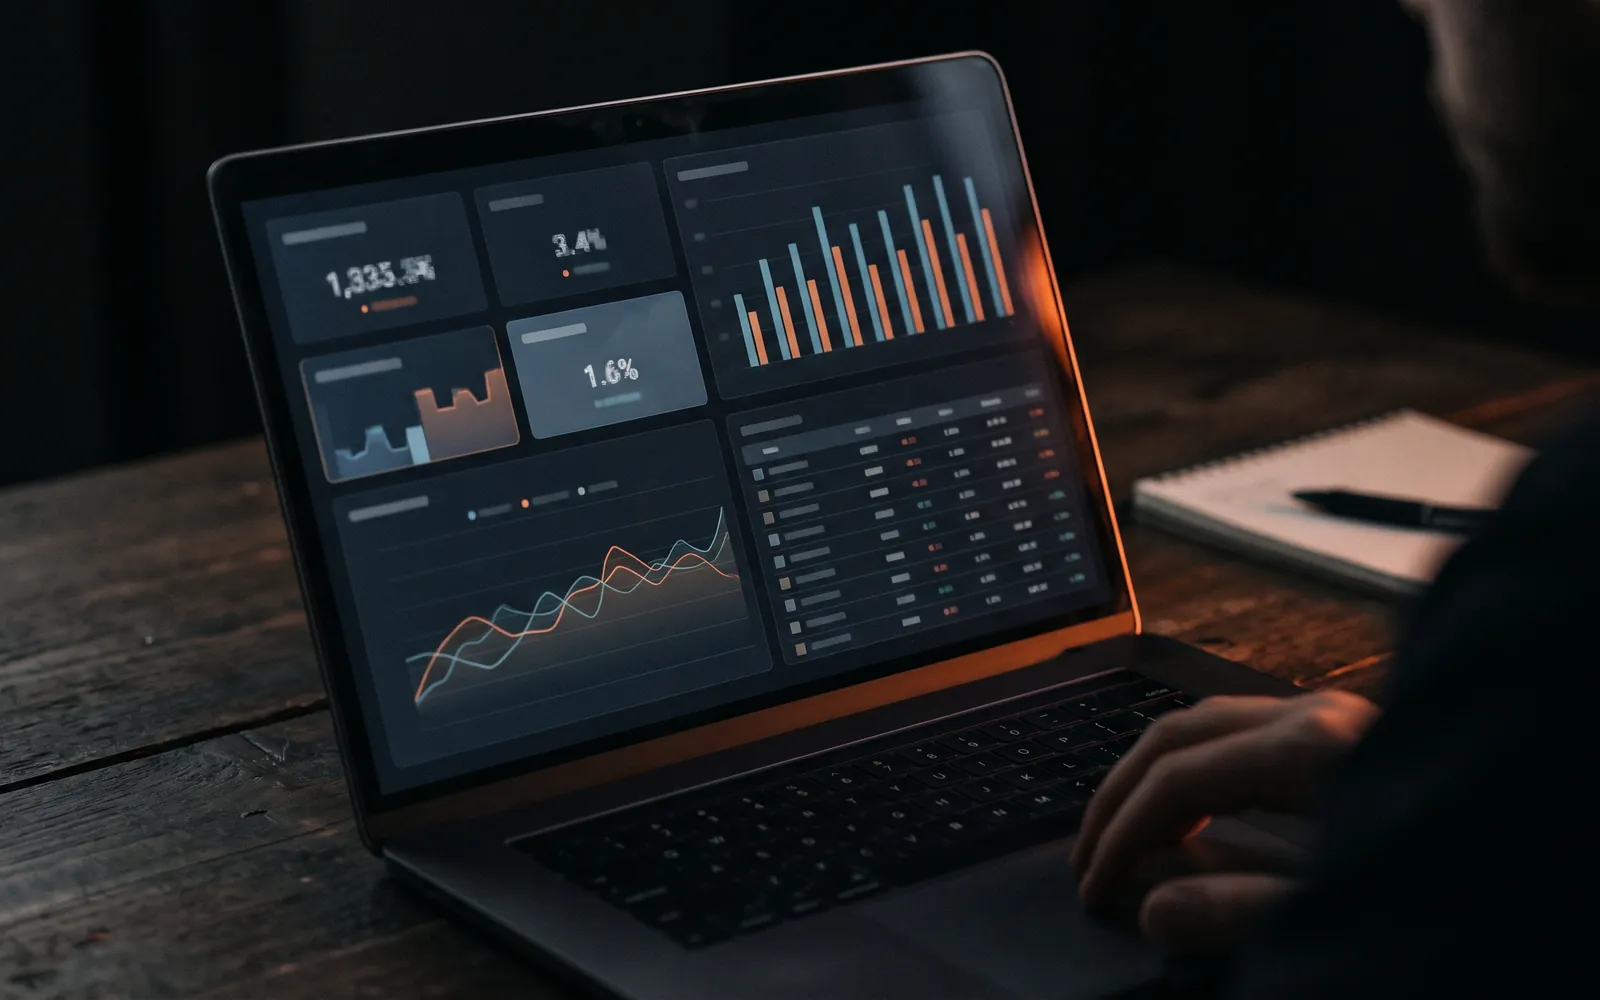
A Looker Studio dashboard for a small business should fit on four pages or fewer and answer the owner's questions without explanation: how many leads came in, from where, at what cost and how many became customers. Looker Studio, Google's free reporting tool, connects natively to Google Analytics 4, Google Ads, Search Console and Google Sheets, and can include other data such as Meta ads or your CRM through connectors or a spreadsheet. Built well, it replaces a pile of logins with one link.
Built badly, it becomes a wall of colorful charts nobody looks at after the first week. This guide covers the data sources to connect, a four-page layout that works for most service businesses, how to bring CRM data in and the mistakes to avoid.
What Looker Studio is good at
Looker Studio (formerly Google Data Studio) takes data from several sources and shows it in charts, tables and scorecards that update automatically. For a small business, its strengths are:
- Free for standard use
- Native connectors to GA4, Google Ads, Search Console, YouTube, Google Sheets and BigQuery
- Date controls so you can switch between this month, last month and the same period last year
- Sharing by link or with specific Google accounts
- Scheduled email delivery of the report as a PDF
Its weaknesses: non-Google data often needs paid third-party connectors or a spreadsheet as a middle step, blending data from several sources can get slow, and design choices are limited compared with paid BI tools. For most small businesses, those limits are fine.
Data sources to connect
| Source | How it connects | What it adds |
|---|---|---|
| GA4 | Native | Visits, key events, landing pages, channels |
| Google Ads | Native | Spend, clicks, conversions by campaign |
| Search Console | Native | Search queries, impressions, clicks from Google |
| Meta ads | Third-party connector or Sheets export | Spend and results from Facebook and Instagram |
| CRM | Sheets export, BigQuery or connector | Leads by source, deals won, revenue |
| Call tracking | Connector or Sheets | Calls by source, qualified calls |
The CRM row is what turns a traffic dashboard into a business dashboard. If your CRM records the source of each lead, ideally from UTM parameters, you can show revenue by channel next to spend.
A four-page layout that works
Page 1: Overview. Five scorecards across the top: spend, qualified leads, cost per lead, new customers, revenue. Each with a comparison to the previous period. Under them, one line chart of leads per week and one table of channels with spend, leads, cost per lead and customers. If the owner reads only this page, they should know how the month went.
Page 2: Paid ads. Google Ads and Meta side by side: spend, conversions, cost per conversion by campaign. A table of the top campaigns and a note field for changes made.
Page 3: Website and SEO. Sessions and key events by channel from GA4, top landing pages by leads, and Search Console queries with clicks and average position. Useful for spotting pages that attract traffic but no inquiries.
Page 4: Leads and sales. From the CRM: leads by source, lead status, conversion rate by source, average response time and revenue won. This is where you see whether a channel brings buyers or just inquiries.
Keep every page to six or eight charts at most. If a chart does not change a decision, remove it.
Add a date range control at the top of every page and set the default to "last month", not "last 28 days". Owners think in calendar months, and the numbers then match invoices and bank statements. A comparison toggle for "previous period" and "same period last year" covers most questions without extra charts. For seasonal businesses, the year-over-year view is the one that matters.
Bringing in CRM data
There are three common approaches, from simplest to most robust:
- Scheduled export to Google Sheets. Many CRMs can export deals daily or weekly to a sheet that Looker Studio reads. Simple and cheap.
- A connector service. Paid tools that sync CRM data to Looker Studio or Sheets automatically.
- BigQuery. Data from the CRM, ads and GA4 lands in one database, and Looker Studio reads from there. Faster with lots of data and better for blending, but needs more setup.
Whichever you use, agree on the definitions first: what counts as a qualified lead, which deal stages count as won, and how lead sources are named. A dashboard that combines data with different definitions will show numbers nobody trusts. If you are still choosing a CRM, check that it can export lead source and deal value; see how to choose a CRM.
Mistakes that make dashboards useless
- Too many charts. Twenty charts on a page means none get read.
- Vanity numbers up front. Impressions and followers in the biggest boxes, leads hidden at the bottom.
- No comparison. A number without a previous period or target tells you little.
- Broken data. A connector that stopped syncing three months ago and nobody noticed. Add a "last updated" date on each page.
- Mixed definitions. "Conversions" in Google Ads, "key events" in GA4 and "leads" in the CRM are different numbers. Label them clearly.
- Nobody owns it. Someone should check once a month that the numbers still make sense.
Dashboard plus commentary
A dashboard shows what happened. It does not explain why or say what to do next. That is the job of a short written commentary, which is the core of a good monthly marketing report. The combination works well: the dashboard updates itself, and the human time goes into the three or four sentences that matter.
How I set them up
I build Looker Studio dashboards as part of analytics and reporting work, on top of a tracking setup that actually records leads. The GA4, Tag Manager and pixels setup costs $550; dashboards with CRM or e-commerce data are quoted individually depending on sources. The reporting service page has details, and the end-to-end analytics page covers connecting ads to revenue.
Let’s talk
about your business
Before the call I review your website and ads. After the call you get an action plan and a price range in writing.

12+ years in online marketing, 100+ clients. I build websites, Google Ads and Meta ads campaigns, CRMs and automations for small and mid-sized businesses. About me →
Looker Studio questions
Is Looker Studio free?
The standard Looker Studio is free with a Google account. There is a paid Pro version for larger organizations with extra management features. Costs usually come from third-party connectors for non-Google data such as Meta ads, if you choose to use them.
Why is my Looker Studio dashboard slow?
Usually because it pulls live data from many sources at once, or uses heavy blends and filters on large date ranges. Fewer charts per page, extracted data, or a Google Sheet or BigQuery table as an intermediate step often speed it up.
Can my team see the dashboard without a Google account?
Reports can be shared with specific Google accounts or by link. For business data, sharing with named accounts is safer than a public link. Decide who should see revenue and customer numbers before you share.
Does a dashboard replace a monthly report?
No. A dashboard shows the numbers; a report explains them and says what happens next. The best setup uses the dashboard for the numbers and a short written commentary for the meaning.
Want a dashboard you
will actually open?
I set up tracking and a Looker Studio dashboard with your ad, website and CRM data in one place. Tell me which tools you use.